This is from 2007 | 19 minute read
Information Architecture: Synthesis Techniques for the Muddy Middle of the Design Process
Abstract
During the process of design, Industrial Designers attempt to draw connections between seemingly disparate ideas. They examine quantitative data provided from marketing or qualitative data gathered from end users, and before they can begin "designing", they must make order out of the chaotic mess of research. The connections that can be formed during this synthesis phase frequently hold the "keys" to innovation; designers visually explore large quantities of data in an effort to understand hidden relationships. These visualizations can then be used to communicate to other members of a design team or to outside disciplines, or can be used as platforms for the creation of generative sketching or model making. Frequently, the action of diagramming is a form of synthesis, and is a way to actively produce knowledge.
Information Architecture has arisen as a field related to interaction design. It is commonly found embedded within the profession of computer science, and is associated with the creation of complicated software. This relatively new field exists to make meaning out of data, and can be applied to disciplines that have little to do with computing or even technology. This paper provides an overview of established Information Architecture modeling techniques, and discusses how they can be applied to the industrial design process during the synthesis phase of design. The text reflects on the nature of this messy and critical period in the design process, and offers methods of quickly making information and even knowledge out of data. Finally, the text briefly describes the changing nature of professional demands on students entering industry, indicating that Information Architect may be a lucrative alternative job title for students graduating from Industrial Design programs.
Introduction: What is Information Architecture?
Information architecture is a relatively new discipline with roots in the fields of computer science and library science, but to call it a science itself would be much too pragmatic: it would not fully embrace the emotional "user-centeredness" of this discipline. To be an "architect of information", one must embrace the end goal of clarity, comprehension and creation. Ultimately, an information architect exists to make meaning out of data.
Information architecture has arisen as a field related to interaction design and the creation of complicated software or web pages. Much of the existing literature supporting this field uses examples and case studies relating to the internet. Cohesive web navigation, structured site hierarchies and a well articulated taxonomy of terms are all critical components of a successful web information structure. Information architects have the luxury of viewing the "forest" (the whole site) and the "trees" (individual pages) at the same time, and can create a cohesive experience that transcends individual page boundaries. Users, however, never see, view or consider the overarching schema of a website. Therein lies the challenge, and thus it is possible to empathize with the difficult nature of the information architect's mantra: you will be overwhelmed, so your users won't be.
The internet has created new challenges to designers, and a new profession has emerged to meet those challenges. However, the internet is only the most obvious example of this sort of limitless environment that requires architecting. An information architect can make meaning out of data anywhere that exists location-based confusion or the ability for non-linear navigation: while walking in a building, while manipulating a small handheld device (such as a digital camera or telephone), while filling out a form, or while driving in a vehicle. All of these experiences involve both two and three dimensional designed artifacts, yet the goal of the information architect is not to give form to an object. Instead, an information architect will focus on the fluid navigation of these interfaces - on creating a meaningful hierarchy and using appropriate vocabulary in order to allow for a usable, useful and desirable experience.
An additional opportunity exists for the application of this new profession: information architecture can be applied within the traditional design process of physical products. During a standard design process, there exists a period of synthesis that occurs between research and design. Techniques for traversing this "Muddy Middle" are rarely taught in design education, and instead are left up to intuition - yet this is the critical moment in the design process where innovative design thinking must occur.
Understanding the Design Process
Industrial design is a process - it is a series of activities (often performed in a non-linear fashion, and with a great degree of subjective overlap between stages) intended to shepherd an idea through the necessary creative steps and into the marketplace. This design process may have more or less steps, and the steps may have various names, but the process is usually quite similar as practiced from company to company. A standard industrial design process will contain the following elements: Discovery, Design, Development and Production.
Discovery
The Discovery phase in the design process is usually characterized by the accumulation of data. This data includes contextual research relating to the discipline being studied, the analysis of competitive products and marketplace trends, and implicit and explicit design constraints from various stakeholders involved in the design process. Ethnography is the capstone of a strong user-centered design process. There are various forms of ethnography, but the basic premise of contextual-based research involves observing or interviewing users in the environment in which they conduct work. This user-centered research calls attention to problems and breakdowns with existing products, services and systems, and provides insight into workflow, domain vocabulary, and attitudes. In addition to researching actual users, designers also study competitive products that have been introduced into the marketplace, and attempt to discover and articulate trends relating to fashion and style. This research often takes an observational slant, and is frequently conducted in response to (rather than in tandem with) marketing data from focus groups or questionnaires and surveys.
Design
After conducting this extensive research, a designer will begin to create generative sketches through a process of ideation. This ideation drawing is first intended to allow for the production of various concepts relating to the target discipline, and is later used as a process of refinement through the creation of variation sketches. A designer will attempt to create a multitude of ideas using "divergent thinking". These ideas may be unconventional, and the designer will often explore multiple ideas at the same time rather than "settle" on a single idea: "In the early stages of a design process it is quite acceptable, and oftentimes very desirable, to be involved in very divergent approaches to the same problem."Woolsey, Kristina et al. Vizability. First edition, 1996, PWS Publishing Company, p43
Development
During Development, a designer will utilize more refined sketching techniques to better visualize details pertaining to the idea in progress. These sketches (also known as renderings) may be computer generated, and while there is still an aspect to problem solving that occurs during development, the focus may shift away from solving problems related to logic or function and may instead emphasize issues of aesthetics and emotion.
Production
Finally, a design is taken through a process of Production. This phase includes issues related to manufacturing (such as detailed CAD work, engineering decisions, as well as the specification of surface treatments), the packaging for the product, and the brand or marketing campaigns that support a product.
All of the steps in this process are difficult and time consuming. However, all are necessary for the development of a successful product. Many designers become quite familiar with the process of ideation sketching, while others embrace the humane nature of user research or the familiarity of the computer and CAD modeling. The most difficult part of this process, however, lies not in the individual steps themselves but rather in the synthesis that must occur between steps - and particularly, between the phases of Discovery and Design. A designer may be handed a document containing user research, or the designer may conduct the research themselves. Either way, an interpretation of this data must occur before generative sketching can begin.
Applying Information Architecture in the Muddy Middle
The end of the discovery phase marks the end of an objective approach to accumulating data. The designer as researcher has been acting as a sponge, attempting to understand the various facets of a problem space or a particular design niche. Prior to beginning the design phase, an interim step must occur. This interim step is known as Synthesis. An interpretative Synthesis of data must occur in order to clearly articulate a definition of opportunity, to seamlessly convert user research into usable design constraints, and to draw connections between seemly unrelated disciplines or ideas.
Finding Definition
Author Richard Saul Wurman is responsible for coining the phrase information architecture.Wurman, Richard Saul. Information Anxiety 2, First edition, 2000, Que, p23His background, in the traditional field of Architecture, seems to rationalize his interest in way finding and navigation. Indeed, the world of information architecture can be thought of as a discipline of map making, but maps need not be related only to geography. People use a map to find their way, and they need to find their way whenever they are lost. By understanding - and visualizing - connections between elements and seemingly unrelated systems, the information architect provides the common trail towards understanding.
A design brief usually includes issues of project scope, project duration and intended deliverables. Rarely, however, does a design brief actually describe what to design. Synthesis allow for the creation of a design focus or opportunity statement, providing definition to an otherwise vague and ill-structured problem. The outcome of the Synthesis phase is the creation of a map that allows for the designer to find their way.
Converting User Research into Usable Design Constraints
During Discovery, designers attempt to learn a great deal about a particular topic through immersive ethnography. By observing and considering real people conducting real work, designers can shed light on problems relating to tools or anthropometrics. These problems are usually relatively obvious to identify and equally simple to solve. Ethnography also uncovers problems relating to workflow, political hierarchy, or culture. These problems are not easy to identify, as they are deeply entrenched in the normative values of individuals, businesses or societies. These problems, however, may be the problems most worth solving - due to their complexity, they may have the strongest social, political or financial repercussions if left unattended. Through visual data interpretation techniques, designers can begin to identify these problems that are otherwise hidden in traditional business practices or societal and cultural standards.
Drawing Connections Between Disciplines and Shifting Placements
Author Richard Buchanan has developed a framework for thinking about innovation. The notion of "placements" is used to describe the conceptual areas of design activities, and includes signs, things, actions and thoughts. For example, an architect is generally thought of as designing a building, which can be thought of as a thing. Buchanan observed that shifting the placements often affords a great deal of new insight: "... innovation comes when the initial selection is repositioned at another point in the framework, raising new questions and ideas."Buchanan, Richard. "Wicked Problems in Design Thinking." The Idea of Design. Ed Victor Margolin and Richard Buchanan. MIT Press, 1996. p9By shifting the placements bounding architecture, an architect might create a sign, action or thought instead of a thing (one can consider the discipline of wayfinding as an example of this placement shift). Thus, Synthesis allows for the consideration of placements, and affords easy shifts in these established boundaries between design activities.
Tools for Synthesizing Data
While Synthesis is critical to move seamlessly from Discovery to Design, it is rarely given the time or attention it deserves. Synthesis may be ignored by companies or individual designers because it is difficult, vague, and highly subjective - it is difficult to know when Synthesis is complete, and it is equally difficult to understand if it has been done "correctly".
Another reason that designers frequently skip the Synthesis step is because of a lack of formal training in methods of Synthesis. There exist formal techniques for conducting research, and formal techniques and approaches to generative design sketching. There remains, however, a large gap in design techniques available for successful interpretation of gathered data. Industrial design programs may spend several courses teaching students to sketch in a specific "design style", but this doesn't assist students in knowing what to sketch. In fact, many student projects are guided by a very articulate design brief - a brief that explains exactly what is to be designed ("you are to design a flashlight"). Few actual projects in industry are this well defined, and students must be prepared to think independently about design.
Several mapping and diagramming techniques have emerged in the field of information architecture. These techniques are used to create understanding when designing for a complicated information space, such as the internet. These techniques can be easily and successfully applied in the Muddy Middle of a standard industrial design process - the Synthesis phase - in order to create systematic organization out of messy data.
Process Flow Diagram
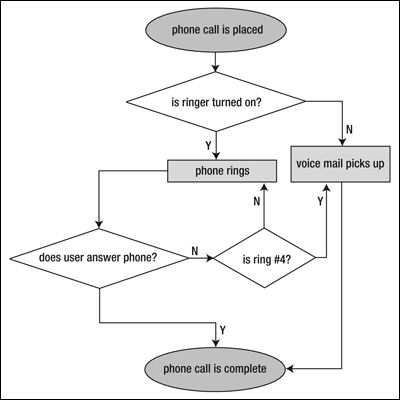
Process Flow Diagrams (also known as Data Flow Diagrams or Decision Tree Diagrams) have traditionally been used in the fields of electrical engineering and in computer science to illustrate the logical flow of data through a system. These diagrams can be created relatively quickly, prior to implementing complicated systems, and then manipulated in order to understand the optimum flow of data. This analysis tool can be used both as a generative exercise as well as an explanatory tool.
 To create a Process Flow diagram, a designer first identifies, through various forms of ethnography, the operators in a system and their roles. Next, the "logic flow" is mapped out to connect the operators with actions. Consider, for example, the phenomenon of a telephone ringing. The phone rings once, and there is a clear path of available (and logical) repercussions to this ring: the caller may hang up, the telephone may be answered, or else the phone will ring again. This will happen several times in a row, at which time a new choice becomes available: the call may be answered by a voicemail system. By creating a process flow diagram, the designer has formed an intimate understanding of the possible logical outcomes of use with a system. While the diagram itself can be useful throughout the project, the act of creating the diagram is of much more importance to the designer. Those involved in the production of such a diagram have created a strong mental representation of the boundaries of a complicated system.
Concept Map
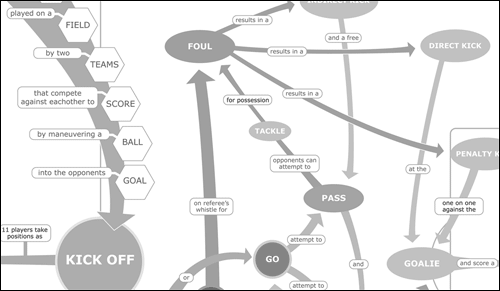
A concept map is a picture of understanding.The example used, illustrating a concept map of a sport, is based on The Baseball Project, an Information Architecture assignment developed by Hugh Dubberly at the Institute of Design, IIT, in Chicago. This material was published in LOOP, the AIGA Journal of Interaction Design Education, November, 2000.It is intended to represent the mental model of a concept - to allow members of the design team to see the "forest and the trees". Generally, a concept map links nouns with verbs. It provides a visual way to understand relationships through literal connections as well as through proximity, size, shape and scale. The tool is intended to illustrate relationships. The act of creation is generative in the sense that the designer must make subjective value judgments on the strength of the relationships.

The first step towards creating a concept map is the creation of a concept matrix. This matrix lists all elements relevant to a particular domain (nouns) and attempts to identify which items have a direct relationship. Consider, for example, an analysis of the game of soccer. One may identify nouns such as Ball, Referee, Goalie, Hands, Whistle, and Shin Guard (as well as nearly one or two hundred other terms). By creating a matrix to illustrate the connections between these elements, the designer is forced to analyze the strength of the relationship. All of the words are implicitly related, as they all have to do with the overarching domain of soccer. However, Ball is more closely related to Goalie than it is to Whistle. By analyzing the connections terms have with one another, the designer is forced to "zoom in" on the details to such an extent that they gain an intimate understanding of a discipline. They can then begin to understand the hierarchy that exists within a large quantity of data. The elements with more relationships become the main branches on the concept maps - they become the "glue" holding together the concept.
Once the matrix is created and these core concepts are identified, completing the concept map becomes a rather simple activity of connecting nouns with verbs. How are Ball, Goalie and Hands related? The Ball can be Touched by the Goalie's Hands. As these are added to the diagram, the designer - and eventually, the entire team - can visually trace relationships between entities and understand how a potential change to one aspect of a system may ripple through the system as a whole.
Contextual Design Models
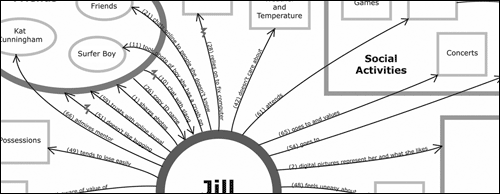
Ethnographers Hugh Beyer and Karen Holtzblatt developed a set of visual models for seeing work in their text Contextual Design: A Customer-Centered Approach to Systems Design.Holtzblatt, Karen & Hugh Beyer. Contextual Design : A Customer-Centered Approach to Systems Designs. Morgan Kaufmann, 1997.While the intention of these work models was to assist Usability Engineers in creating usable software, the visual style of making connections is ideal for designers focused on interpreting complicated data. Beyer and Holtzblatt developed five models in order to capture the nuances of ethnographic data: Flow, Cultural, Sequence, Physical and Artifact.
The Flow model captures the movement of information without regard for time - it allows for a visual synthesis of data and information transfer. The Cultural model attempts to illustrate only interpersonal relationships, and to articulate the affects of political or social influence. The Sequence model shows the triggers, intentions and actions that occur in order during work, allowing for an understanding of implicit task structure and hierarchy. The Physical and Artifact models capture the built environment and the objects used to complete tasks.

The common visual style of the models creates a language for seeing and understanding work as it occurs, and the models can then be referenced throughout design: the designed object can be introduced into the models and predictions can be made concerning the effects this object would have on the entire system of work.
Affinity Grouping / Card Sorting
The Affinity Diagram is a simple tool that can be used to organize ideas into naturally occurring groups. In a group, ideas are brainstormed and recorded onto individual sticky notes or cards. These are accumulated in no particular order until a large quantity has been developed. Next, they are sorted into groups in a bottom-up approach. Rather than creating groupings and then placing cards into them, the groupings bubble-up as likeness (or affinity) between ideas emerge. By allowing the groupings to emerge naturally, designers can avoid their preconceived understandings or assumptions about how things "should" be organized and can instead arrive at a natural hierarchy and structure.
The Potential for Career Diversification
This paper has presented techniques and tools from the profession of information architecture that can be applied for the purposes of Synthesis within industrial design. It seems quite logical that, after becoming skilled in visualization and diagramming techniques, industrial design students may decide to enter the professional world as information architects, proper.
This provides an important opportunity for career diversification in the face of offshore product development. Design strategist Elaine Ann explores this very issue in a short article entitled "The Top 10 Myths and Truths about Design in China." As she explains, there is increasingly less command in the United States for Industrial Design talent in the formal sense, but a greater need for the intellectual pursuits of design process: "DESIGN is a very big word, from designing a corporate brand strategy, designing an innovative way of cleaning, or designing the styling of a toothbrush - we all call it 'design.' The bad news is if you are in the last category of 'design' - product form-making or styling business - it is very likely that such design services will truly move to China ... Designers in the U.S. need to quickly engage in more strategic levels of design, and to create innovations that revolutionize businesses."Ann, Elaine. The Top 10 Myths & Truths about Design in China
This alternative job title may, in fact, prove to be a more lucrative opportunity for students of design. While design has historically been associated with fields of fine arts (and has, therefore, found a pay scale commiserate with the applied or commercial arts), information architecture finds its roots in the field of computer science. This has typically afforded a higher level of compensation.For example, the 2005 core77 salary survey of 1222 industrial designers found a mean salary of $53,144. The 2005 Information Architecture Institute salary survey of 469 information architects found a mean salary of $79,914Students of design skilled in these visual tools of synthesis may wish to explore opportunities that are directly entrenched in the profession of information architecture, bringing the traditional process of industrial design to use in various other disciplines.
Conclusions and Reflections
During the process of design, industrial designers attempt to draw connections between seemingly unrelated ideas in an effort to understand ethnographic research data and to produce innovative design solutions. They examine data and must make sense of this data before ever beginning to give form to an idea. The action of diagramming is a form of synthesis, and is a way to actively produce knowledge that can be applied in the generative process of designing. By utilizing diagramming techniques in the design process, regardless of intended outcome, designers can easily traverse the muddy period of Synthesis that occurs between Discovery and Design. Designers can make meaning out of data, and can ultimately use this enlightenment to create cohesive, compelling and innovative design solutions.
Works Cited
- Woolsey, Kristina et al. Vizability. First edition, 1996, PWS Publishing Company, p43
- Wurman, Richard Saul. Information Anxiety 2, First edition, 2000, Que, p23
- Buchanan, Richard. "Wicked Problems in Design Thinking." The Idea of Design. Ed Victor Margolin and Richard Buchanan. MIT Press, 1996. p9
- The example used, illustrating a concept map of a sport, is based on The Baseball Project, an Information Architecture assignment developed by Hugh Dubberly at the Institute of Design, IIT, in Chicago. This material was published in LOOP, the AIGA Journal of Interaction Design Education, November, 2000.
- Holtzblatt, Karen & Hugh Beyer. Contextual Design : A Customer-Centered Approach to Systems Designs. Morgan Kaufmann, 1997.
- Ann, Elaine. The Top 10 Myths & Truths about Design in China. http://www.core77.com/reactor/08.04_china.asp
